Who wouldn’t want to have a better ecommerce site? According to eticaret.gov.tr 2021 data, there are approximately 484,347 businesses engaged in e-commerce activities in Turkey. 14,699 of them provide services on their own websites. Fortunately, businesses that employ us, digital marketing specialists, always start one step ahead. I personally know e-commerce platforms that can come to good places even without any advertising investment. So what is the secret that leads these e-commerce platforms to success? Of course, determining KPIs in various categories and performing analyzes by monitoring them!
What is KPI?
The concept of KPI, which we often hear in business life, can actually be defined as the “target” that has existed for years. KPI stands for Key Performance Indicator.
There are various KPIs in all areas of the business world and these KPIs need to be followed regularly. Regardless of accounting, digital marketing or call center, KPIs can be determined or regulated at the beginning of the year or in various periods in all departments.
For example, Human Resources determines their KPIs according to various parameters such as the average working time of the personnel, their contribution to the company, satisfaction, and loyalty rate, and takes actions to move them further when they achieve the target. If it fails to meet the target, it reanalyzes the inputs used while determining the KPI and tries to explain the reason for the failure.
KPIs are one of the most effective ways to identify what companies and internal departments need to develop business, their shortcomings or inconsistencies in inputs. Achieving company targets or discussing the possibility of this also makes a positive contribution. Developing a job by doing it; KPIs connect staff more to the job in front of them, and therefore to the company, as it is of great importance to break down and re-make and analyze. Without KPIs, employees would not know why they do what they do, what they should pay attention to when doing that work, how they do it, how it will affect them, and the effort they need to put into completing the work.
To sum up, determining a KPI is very important in business life. In sectors where the amount of investment is large, such as e-commerce, it is inevitably critical.
KPI in eCommerce
By determining the right ecommerce KPIs, you can track and improve website visits, a user’s conversion to a customer, the relationships between products, the completion of adding to the cart and the sale, and you can increase the conversion rate without leaving a single penny in your pocket.
Monitoring KPIs and applying various fixes with the analysis performed will cause you to optimize your website much more. Because optimization cannot be performed only at SEO or advertisement level; software, user experience and visual elements are also very important.
When it comes to e-commerce, a lot of data goes into the business. So it might seem a little overwhelming. However, with the right personnel configuration, you can overcome this task. So what should we follow?
Website Traffic
Although there are many variables, high traffic means high recognition and high orders! According to the Similarweb data in Turkey, Trendyol has 222 million monthly visitors, while Hepsiburada has 90 million monthly visitors. Of course, you can easily track your website traffic through Google Analytics.
You can access a lot of visitor data through Google Analytics. For example, you can see how many people come to your site via social media in a certain period through Acquisition > All Traffic > Channels. You can also discover similar sites through Similarweb and have a rough look at your place in the competition.
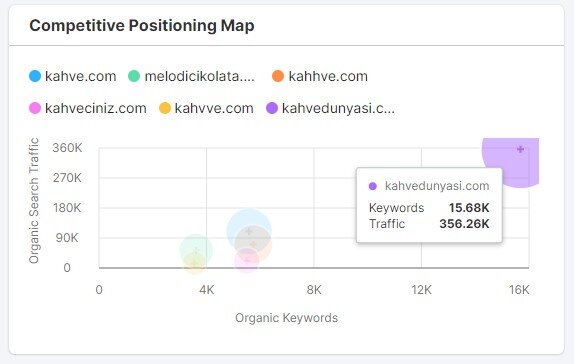
For more detailed competitive analysis, you can use Semrush. For example, you can generate data on parameters such as keyword-based competition, competition in traffic from ads.

You should follow the traffic-related KPI on a monthly, quarterly and annual basis, identify catalysts such as the covid-19 shutdown process, and analyze the returns of your ads and other investments at the point of conversion to traffic.
Time Spent on Site
This metric indicates the amount of time visitors spend navigating your site before closing your site’s window. The time spent on the site -usually- is directly proportional to the attractiveness of your site. In order to keep the user on your site more, putting other products that may attract the attention of the user under the products is one of the most known and applied methods.
No calculation is required for this KPI. You just need to read and analyze the value through Google Analytics. You can set the time spent on the site KPIs monthly, quarterly or annually and increase your target.
In addition, Bounce Rate, which I don’t think I need to open a separate topic for, is also an important metric. Unlike time on site, it is a metric that is inversely proportional to the attractiveness of your site. If your site does not attract attention, the Bounce Rate will be quite high. Your goal is to bring that number down!
Number of Orders
Of course, the first item for an e-commerce site could be nothing more than the number of orders. Increasing the number of orders without “but” is a preferred method in some scenarios and growth models, even if it reduces net profit to negative. But these scenarios are very rare and you still prefer controlled growth with other KPIs.
Many e-commerce sites operate with special e-commerce software. Although there are currently various reports of these software; You need to track your orders on a daily, weekly, monthly, quarterly and annual basis. Of course, it is not enough just to follow; you need to compare them with various inputs and determine the reasons that increase or decrease your orders.
It can be recommended for small businesses or e-commerce sites with a small product range to monitor your orders only by the number of orders or the number of products. But if you have more than 100 products, you now have to keep track of them with much more data than the big window. For this, the first data you need to follow is gross income. You need to track your daily, weekly, monthly, quarterly or annual gross income and compare it to previous periods. If your products contain imported or imported raw materials, I strongly recommend that you follow this data on USD basis.
Tracking the number of orders as well as gross revenue while tracking orders will help you determine the average revenue per order (which is another KPI). In this way, you will be able to see whether your business development pays off as an increase in the number of orders or the number of products in the order.
Net Profit
Of course, we are opening an e-commerce site for this! You can use the Net Profit = Gross Income – Expenses – Product Costs formula that you can calculate even with the simplest mathematical knowledge. According to the research of New York University, as of January 2022, the average net profit margin of 60 e-commerce companies was 7.26%. It would be a mistake to constantly monitor and revaluate the Net Profit KPI. Quarterly plans may be more efficient for this.
Average Order Value
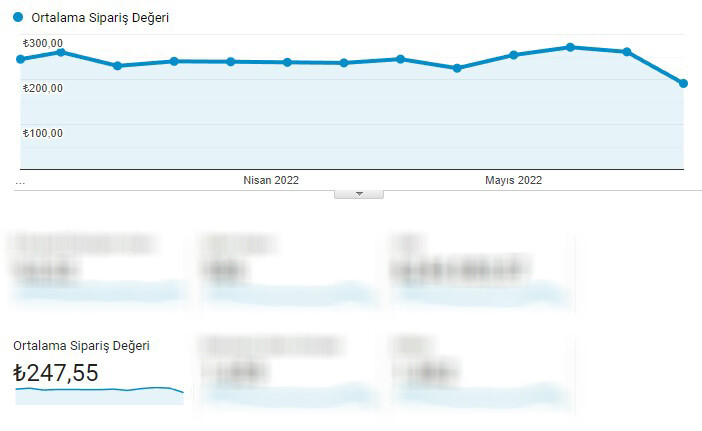
Average Order Value (AOV) is one of the most important KPIs in online and local commerce. So much so that many companies try to increase the basket average with phrases such as “add 10 TL more product, get free shipping” or “we recommend for you” before payment on the basket screen. Calculating AOV is quite easy; You can find the average gross revenue for an order when you divide your gross revenue by your total number of orders. Again, it would be better to check the net profit KPI at the beginning of each quarter and make plans to increase the AOV value in the next quarter.
If there is no area in your software where you can track it, or if you do not want to constantly graph it, of course Google Analytics, which comes to our rescue in any case, can be used for this. All you need to do is to set your metric for Average Order Value from the Conversions > E-commerce > Overview field.

Add to Cart Rate
One of the data that is generally ignored, but gains importance with the results to be obtained with the KPI tracking, is the Add to Cart Rate. This data is calculated as the ratio of adding to cart to all sessions when customers decide to purchase the product while browsing the products. Add to cart rate is calculated as (Add to Cart Sessions) x (100) / (All Sessions).
In relation to this data, the abandonment rate of the shopping cart gains great importance as well as the return rate of those who add it to their cart. You should develop the Add-to-Cart Rate KPI in quarterly periods and interpret it to help other analyses. Although it does not produce a result on its own, you can determine if there are any problems in terms of your prices, product descriptions or user experience. You can manage your e-commerce site much more efficiently, especially by testing whether the KPI can be reached after the changes you have made.
Customer Lifetime Value
Although it varies according to the sector, according to a few e-commerce sites that I have analyzed, the customer lifetime value of a business with an average basket of 100 TL is around 180 TL.
Customer lifetime value (Customer Liftime Value – CLV) is a great KPI to predict how much an average customer will spend during their relationship with your e-commerce site. After calculating the average customer lifetime value with historical analysis, you can determine the cost of acquiring a customer. In this way, you can run your ads, discount coupons and campaigns in a much healthier way.
There are many different formulas for calculating customer lifetime value. I leave an example of them:


- CFi,j,t: profit from customer i as a result of activities related to category j products in a time period t
- h: Timeframe to be estimated
- d: Discount rate
- J: The number of products the firm offers for sale
But let’s not forget that there is a Google Analytics trying to make it easier :) Audience analysis in Google Analytics can also give an idea about this.

Although the CLV value is mixed, you can be sure that you will get analyzes worth working with an expert.
Customer Retention Rate
Your e-commerce site’s customer retention rate is the percentage of customers who continue to shop over a period of time. It is recommended to monitor KPIs on a 3-month, 6-month or annual basis.
It is quite easy to calculate. (((Number of Current Customers) – (Number of Customers Acquired During the Period)) x 100) / (Number of Customers at the Beginning of the Period)
You can increase the number of loyal customers by making this calculation regularly and updating the determined KPIs from period to period.
Conversion Rate
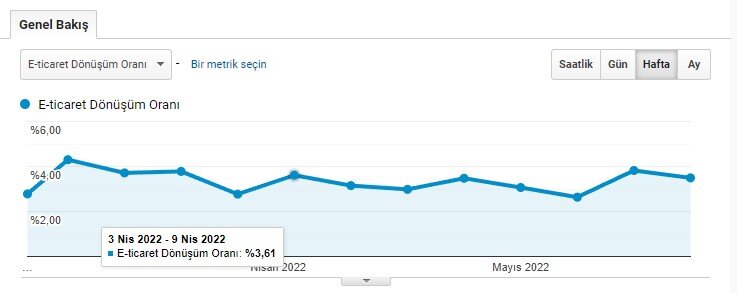
Curious to what degree you can convert your site’s traffic into sales? One of the most important KPIs when it comes to e-commerce is Conversion Rate. Simply put, conversion rate is a key performance indicator that shows how many of every 100 visits you can convert into sales.
So what’s the use of knowing this? Of course, with the conversion rates you calculate for each acquisition channel, you will have the advantage of identifying the most valuable source of visitors and investing in this channel. Or you will keep your stocks in this direction by calculating the conversion rate of each category or brand.

The simplest calculation method would be to divide the number of orders by the number of visitors and multiply the resulting number by one hundred.
ROAS
It is the ROAS value, which is one of the factors that also determines the advertising quality, especially for agencies. ROAS stands for Return On Ad Spend and can be translated into Turkish (in our country) as Income from Advertising Spends. ROAS, which ensures the efficient use of advertising costs, is one of the most critical KPIs to follow, as it is often used as targeting.
The formula (Ad Revenue / Ad Cost) x 100 can be used to calculate ROAS. For example, if we earn 1000 TL in gross revenue from an advertisement where we spent 100 TL, our ROAS value would be 1000%. While high ROAS always indicates that things are going well, low ROAS means that you need to reduce your ad spend or increase the conversion rate. If e-commerce site owners work with the agency, they should pay close attention to this metric and perform the KPI improvement on a monthly basis.
Customer Happiness
One of the most important data you need to monitor for your ecommerce site is the feedback from your customers. There is more than one way to collect this feedback. I recommend that you collect data with product comments, post-order communication scenarios, Google surveys, forum sites, comments on your social media accounts, complaint collection sites and complaints to legal authorities, categorize and archive the problems in accordance with the analysis.

